> ## Documentation Index
> Fetch the complete documentation index at: https://moengage-analytics-query-api-docs.mintlify.site/llms.txt
> Use this file to discover all available pages before exploring further.
# How To Use the MoEngage SDK Logger?
> Use the MoEngage SDK logger from your dashboard to debug implementation issues without sharing builds.
### Instructions:
Perform the following steps:
1. Log in to your MoEngage dashboard.
2. Go to the **Test and Debug** section.
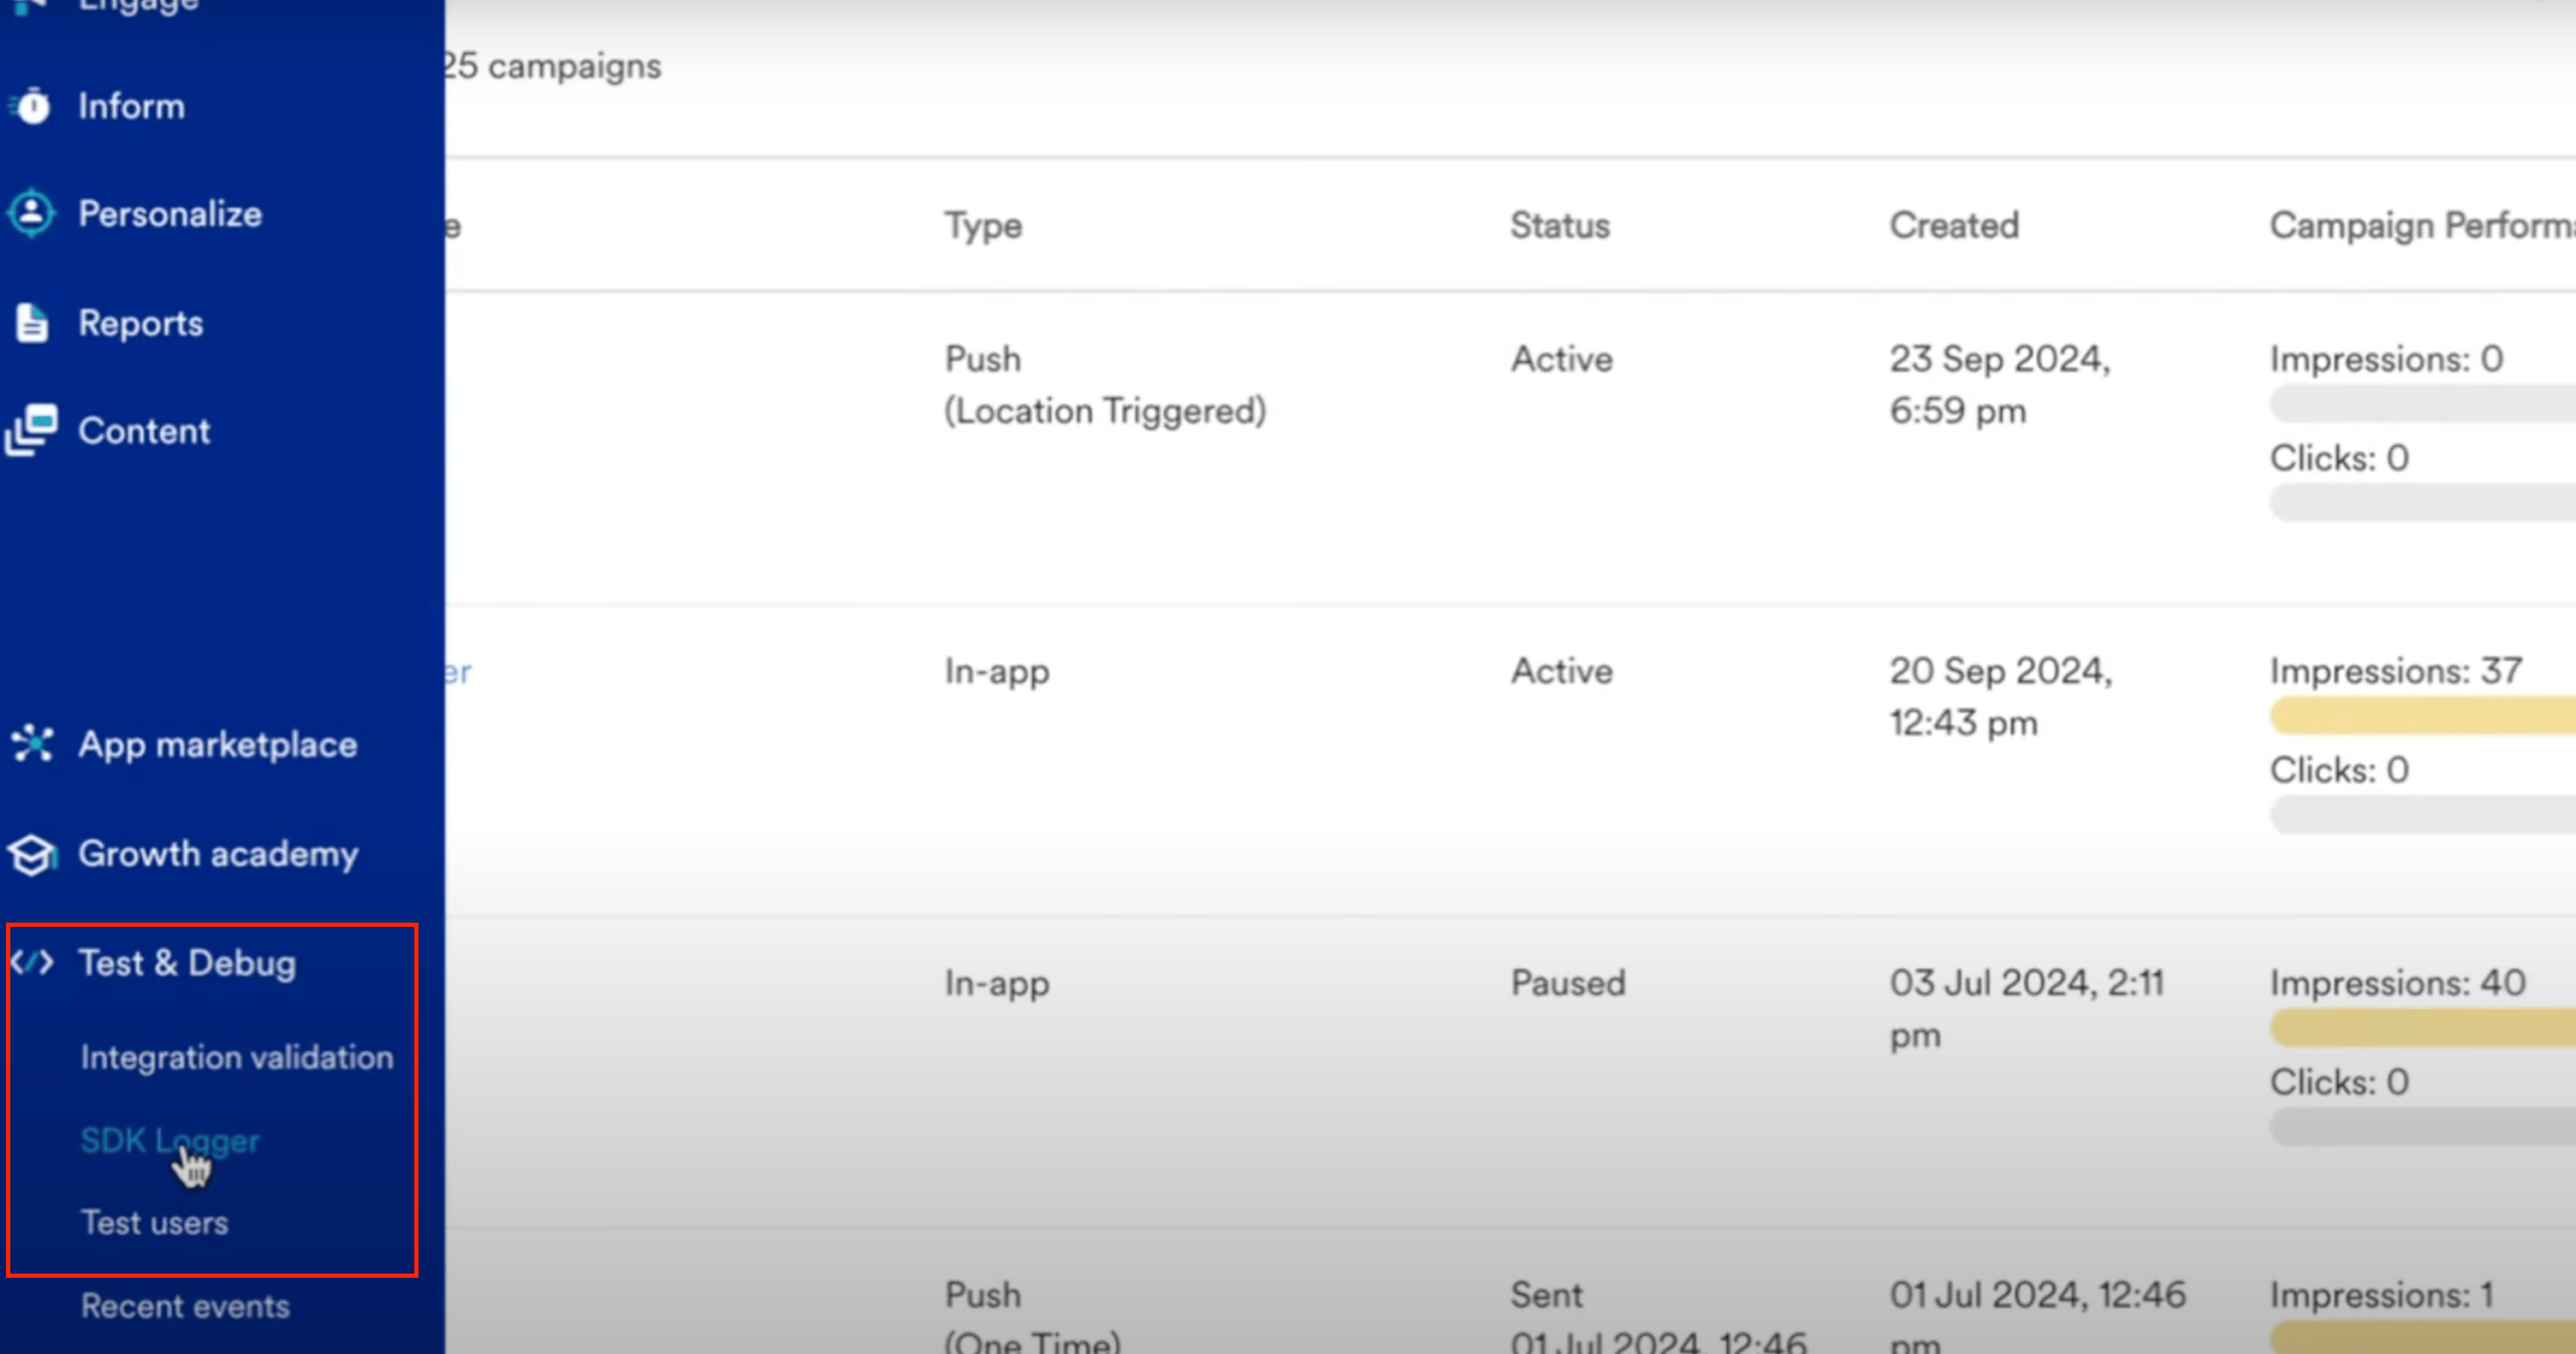 3. Select the **SDK logger** tab, and a QR code will appear.
By default, the logger session remains active for two hours. You can extend it from your test mobile device.
The MoEngage SDK logger is supported from the following SDK versions:
* Android SDK 13.04.00
* React Native SDK 10.3.0
* Flutter SDK 9.0.0
* Capacitor SDK 5.0.0
* Cordova SDK 9.0.0
3. Select the **SDK logger** tab, and a QR code will appear.
By default, the logger session remains active for two hours. You can extend it from your test mobile device.
The MoEngage SDK logger is supported from the following SDK versions:
* Android SDK 13.04.00
* React Native SDK 10.3.0
* Flutter SDK 9.0.0
* Capacitor SDK 5.0.0
* Cordova SDK 9.0.0
.png?fit=max&auto=format&n=SJOLBR89b7jJYB-u&q=85&s=728721ba8a111e8e8d39ab6a2a22feab) 4. To start the logger, scan the QR code with your mobile device. A pop-up will appear with a link.
5. Open the link and click the **Click here** button. The link will either open the app or display a list of applications integrated with the MoEngage SDK.
4. To start the logger, scan the QR code with your mobile device. A pop-up will appear with a link.
5. Open the link and click the **Click here** button. The link will either open the app or display a list of applications integrated with the MoEngage SDK.
.png?fit=max&auto=format&n=wHi113xbuvnA8Fpn&q=85&s=d86e885f26ba5557e6ac3bff480ea7be) 6. Select the application you want to debug. A page displaying logger information will load.
6. Select the application you want to debug. A page displaying logger information will load.
.png?fit=max&auto=format&n=cDJP_V8ipiuGEajy&q=85&s=a7fd6a03066f8368e3f4c0a6449e93d0) 7. Close and reopen the app. Perform the steps to replicate the issue.
8. Return to the dashboard and click **Refresh** to view a list of all active sessions.
7. Close and reopen the app. Perform the steps to replicate the issue.
8. Return to the dashboard and click **Refresh** to view a list of all active sessions.
.png?fit=max&auto=format&n=wHi113xbuvnA8Fpn&q=85&s=dd1c8e482c11dfd8097f271233fb964e) 9. Select the latest session identified by your device model.
10. If the logs do not appear, click **Refresh** again. Once the logs appear, click **Copy Session ID** and share the ID with the MoEngage support team for debugging.
9. Select the latest session identified by your device model.
10. If the logs do not appear, click **Refresh** again. Once the logs appear, click **Copy Session ID** and share the ID with the MoEngage support team for debugging.
.png?fit=max&auto=format&n=SJOLBR89b7jJYB-u&q=85&s=f32929b272461c1bc1360699ae1abab2) A developer could check the logs for any errors or exceptions. You can also use the search field to find specific logs.
A developer could check the logs for any errors or exceptions. You can also use the search field to find specific logs.